

In 2016, Juhee Bae from South Korea came to Sweden as a post-doc to apply visualisation in AI. Her goal is for people to understand machine learning better by explaining data models and their results using visual tools. She believes that a better understanding will build trust in the technology. In 2019, Västra Götaland region granted her EU funding from the Mobility for Regional Excellence Programme 2020 (MoRE2020) to continue her third-cycle studies in Belgium. There she did research that allows us to visualise global migration patterns and their economic, social, and political impacts.
It was in October of 2019 that Juhee Bae packed her bags and moved into a small studio apartment in the city of Louvain-la-Neuve in Belgium. Not long after her arrival, she had settled in with her new colleagues at the Institute of Economic and Social Research at Universté catholique de Louvain (UCLouvain) and end-user of the results the World Bank. Juhee and her colleagues worked with Gallup data which they analysed using this ‘magic box’ called machine learning.
Understanding relationships between things
What does visualization of machine learning look like? Juhee explains with reference to things that most people can relate to.
- Visualisation helps us understand relationships between things by providing an overview. It is like when you are at the airport looking at flight schedules. People focus on their flight number and the arrival/departure time on the board because they have their own flight to take or are waiting for someone. But the flight manager has to understand the big picture, the statuses, and relationships between these flights, in order to grasp the overall situation. When it comes to more complex structures, visualisation and machine learning together can help us understand very complicated underlying structures, says Juhee.
Juhee’s research is focused on explainable AI, which could be seen as similar to the information on the flight board. Thanks to this board, everyone gets to their gate and flight in time. Of course, this is a simplification of the technology, but it’s one way to explain it in broad general terms.
What does machine learning show us?
Juhee’s project with her colleagues ultimately shows us how important it is to see the big picture and not just selected parts of it. Machine learning algorithms run without any explicit specification of relationships, and fewer manual function operations compared to methods used in econometric studies, thereby reducing the possible bias introduced by the expertise of the modeller. Machine learning can provide knowledge based on the data and focuses on the predictive accuracy of complex relationships. Figure 1 shows different classification methods and that linear relationships cannot be assumed in some cases.
- Thanks to this technology, it is now possible to analyse huge quantities of data to identify patterns - patterns that would otherwise be unknown because we cannot process such huge amounts of random information. Next, this information needs to be presented in a way that provides a better explanation, says Juhee.
-
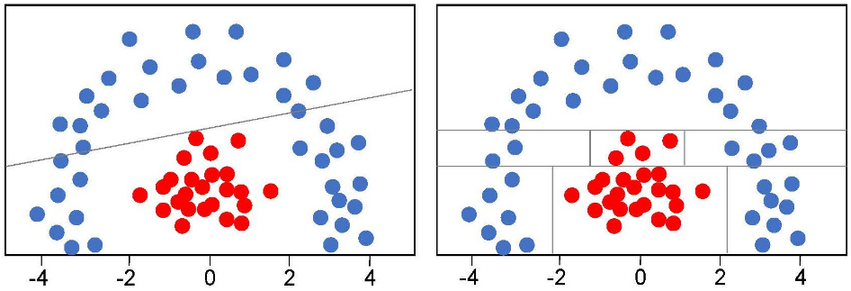
Figure 1. (a) Linear regression does not classify the data effectively. (b) Machine learning with a decision tree classifies the data in more detail.
-
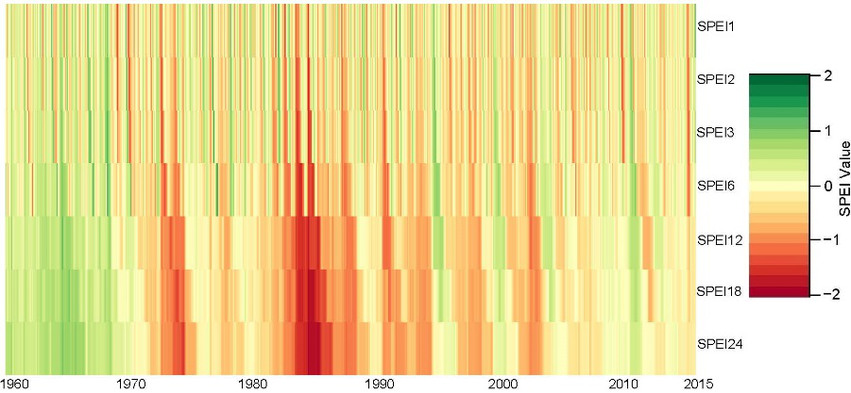
Figure 2. Various timescales of the SPEI drought index between 1960 and 2015 in six West African countries. Red means severe drought, especially between 1980 and 1990.
-

The Team: John Aoga (Computer Science post-doc), Juhee Bae (grant receiver Computer Science associate senior lecturer), Stefanija Veljanovska (Economy post-doc), Siegfried Nijssen (Computer science professor supervisor), Pierre Schaus (Computer science professor, supervisor) and Frédéric Docquier (Economy professor and project collaborator).
Analysing the migration intentions of six West African countries
In the first work package, looking at data over several years, the team wanted to see if the demographic and socioeconomic characteristics of individuals and the weather were a factor in migration intentions. The reason for using migration intention, not the actual flow of migration itself, was due to the lack of reliable data with multiple variables.
The Gallup data collected in 2009-2015 was from six West African countries whose primary source of income is agriculture. The demographic and socioeconomic characteristics included age, gender, and network abroad of individuals who have intentions to migrate internally and internationally. With the weather, the focus was a drought index called the Standardized Precipitation Evapotranspiration Index (SPEI1). The researchers compared three machine learning methods and found contributing factors that influenced the intention to migrate. See figure 2. For more information access publication at arxiv.org.
A more accurate score with machine learning
Missing data, or rather a lack of data, is a common problem in data science. In the data Juhee worked with, values were missing because of the nature of survey interviews which are conducted once or twice each year. Even civil wars stop the interviews in certain regions. Missing values are not uncommon with real datasets and researchers use various imputation methods in those cases.
In the second work package, “Forecasting Migration Intention using Multivariate Time Series”, Juhee and her colleagues investigated the different granularities of time series data (e.g., yearly, monthly), random forest missing value imputations, and long short-term memory models (LSTM) to predict migration intentions. The prediction performance improved with fewer errors with random forest imputation compared to simple zero filling. This was presented at the 2020 International Symposium on Computing and Artificial Intelligence (ISCAI 2020) on 15-17 November 2020.
The need to predict
Human migration is constant. It is important to predict it beforehand in order to better understand what motivates people to migrate. With the current pandemic, the mobility of migrants is limited because of travel restrictions and there is ongoing research on migration trends using the recently available data. By revealing the patterns, we are able to stay one step ahead and allocate resources appropriately. We have the data, but before machine learning, it was impossible to reveal the underlying patterns, the relationships that play a big part. Knowing them ultimately leads to making better decisions.
- Although I am not familiar with machine learning methodologies, I am impressed with the results and the insights provided. For example, it is quite impressive how much the predictive power is improved, says Caglar Ozden, Lead Economist at the department of Development Research Group Trade and International Integration, World Bank.
Effort worthwhile
Her year in Belgium under MoRE2020 has come to an end. Now Juhee has returned to Sweden and the University of Skövde to take up a position as an associate senior lecturer. During her year abroad, she learned that working across different research disciplines is a challenge but that good things come out of co-operation and collaboration that make the effort worthwhile.
- Looking back, I never thought that I, a software engineer from South Korea, could come this far and be a migrant myself to many different countries. I am very grateful to have been given this opportunity, working on interdisciplinary projects. Although I stayed in my room most of the time due to covid 19, I enjoyed working abroad. In the future, I hope to keep on bridging interdisciplinary gaps and solving user-driven, real-world problems, concludes Juhee Bae.
Project funding
This project received funding from the European Union Horizon 2020 research and innovation programme under the Marie Skłodowska-Curie grant agreement No 754412.