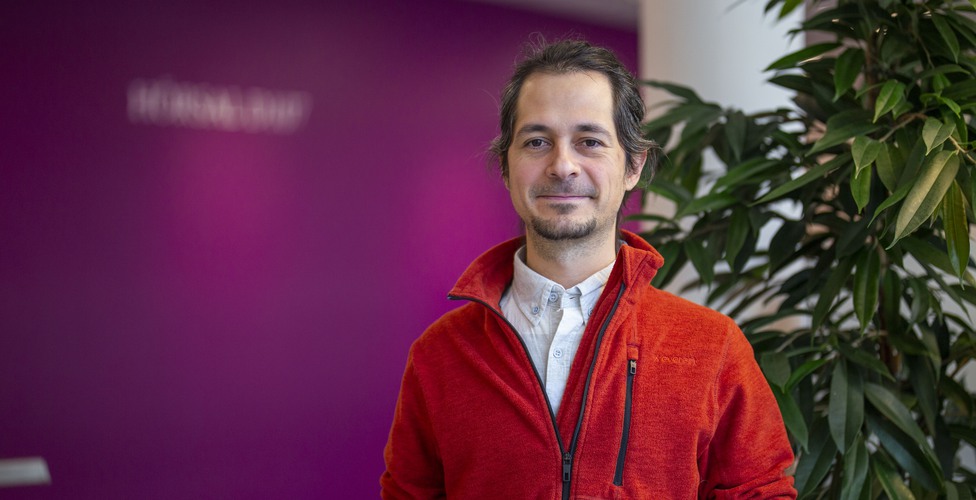
Large amounts of data are constantly being collected, with the intention of understanding the world and, quite often, to make predictions about it. Elio Ventocilla, PhD Student at the University of Skövde, has in his research tried to help with the former – to understand the world better. He has now created a process model that describes how it is possible to use different techniques to visualise cluster patterns in large datasets.

Every day, everywhere, data is being collected. It can be about everything from people's movement patterns, to the number of bird species in Sweden or which pages you browse on your smartphone. Data can give a rough representation of the world, how it looks and works, and is often used by researchers in order to try to understand it better. Elio Ventocilla explains this by using trees as an example.
– If we, for example, were to measure the width and height of all trees in Sweden, we would get a snapshot of what Sweden looks like, through those two variables.
Then, if the trees are placed, in the form of dots, in a diagram, they would end up in different places depending on the width and height of the trees they represent. But just width and height do not say much about trees. If information about the size and colour of the leaves were also collected, it would give a better representation of the Swedish trees. But to be able to see all four variables – width, height, colour and shape of the leaves – at the same time, the dots in the diagram must have even more visual attributes.
Problems when the variables increase
– We can, for example, change the size and colour of the dots. All this works for a while, but when additional information needs to be added, such as the age and bark of the trees, we soon run out of visual attributes to represent it.
There are advanced methods that can be used to project data in a two-dimensional diagram and identify groups or cluster patterns. However, the usefulness of the methods degrade as the number of data (trees, in this case) and variables grows.
– My thesis is about scaling those methods so that they can be used to reveal cluster patterns in large datasets with millions of samples and hundreds of attributes.
Two main contributions
In his research, Elio Ventocilla has made two main contributions. One is a process model that describes how to integrate different techniques to visualise cluster patterns in large amounts of data. The model can be used in the creation of other applications tailored to specific purposes, such as physics, biology or marketing.
The second is an open source library that implements one of the possible configurations of the process model, so that data scientists can use it in their research.
– One of the library's main benefits is that you can use it to uncover clusters in datasets that are so large that they are distributed across many computers.
The industry is next
Working in the industry, is next for Elio Ventocilla.
– I want to use and test the knowledge I have gained during my PhD studies, to add value through products and services. I may return to the academic world after honing my skills in the industry.
Elio Ventocilla defends his thesis "Visualizing Cluster Patterns at Scale: A Model and a Library" on Friday 12 March in Insikten, Portalen in Skövde and on Zoom.
